
I. Main Categories and Applications
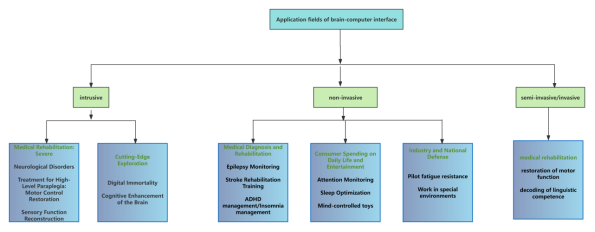
There are mainly three technological routes: invasive, semi-invasive/interventional, and non-invasive.
- Invasive (more commonly used in medical treatment fields): refers to signal acquisition and recording from tissues beneath the skull. Common techniques include electrocorticogram (ECoG), single-neuron action potentials (spikes), and local field potentials (LFP). Through neurosurgical implantation into the cerebral cortex or gray matter, these methods directly contact neurons, enabling the recording of neural signals with the highest signal-to-noise ratio and the greatest clarity.
- Semi-invasive / interventional: implanted above or below the dura mater or within blood vessels, without directly penetrating brain parenchyma, balancing signal quality and trauma risk. Localized invasive brain-computer interfaces typically obtain local neuronal activity signals by implanting microelectrode arrays into the brain, such as local field potentials (LFP).
- Non-invasive (more commonly used in medical and consumer life scenarios): uses non-invasive acquisition techniques to collect brain response signals on or near the scalp surface. Common methods include functional near-infrared spectroscopy (fNIRS), electroencephalography (EEG), functional magnetic resonance imaging (fMRI), and magnetoencephalography (MEG). These are safe and non-invasive, but due to limitations in signal strength and noise interference when collecting signals outside the brain, the currently achievable brain-computer interaction performance is limited. They are applied across a wide range of daily and industrial fields, such as rehabilitation training, education and entertainment, smart living, and manufacturing, mainly targeting industrial and consumer markets.
The choice among these three routes involves a trade-off between signal quality, risk/trauma, and application scenarios.
Invasive: exchanges the highest risk for the best performance, aiming to solve the most severe medical challenges (e.g., severe paralysis).
Non-invasive: trades off performance for safety and accessibility, dominating current consumer applications and part of the clinical rehabilitation market, serving as a “pioneer of mass adoption.”
Semi-invasive / interventional: seeks the optimal balance between risk and performance, representing a highly promising “compromise solution” for future medical applications. Recent exploratory approaches include minimally invasive vascular stent electrode arrays and in-ear electronic devices.
Figure 1: Brain-computer interface applications
II. Global Brain-Computer Interface Market Size and Current Status
In recent years, brain-computer interface (BCI) technology has become one of the most prominent growth areas at the forefront of global science and technology. With the rapid development of neuroscience, artificial intelligence, and microelectronics, BCI technology is gradually moving from laboratories toward commercial applications, opening up new opportunities in multiple market fields such as healthcare, smart devices, and virtual reality. In particular, in the medical field, the application of BCI technology provides new possibilities for treating various neurological diseases, bringing hope for a new life to a large number of patients. At the same time, applications in non-medical fields continue to expand, creating more business opportunities for the BCI industry. According to statistics from Grand View Research, the global brain-computer interface market size grew from USD 1.2 billion in 2019 to approximately USD 2.48 billion in 2024, with a compound annual growth rate of over 15% from 2019 to 2024.
Figure 2: Global Brain-Computer Interface Industry Market Size (2019–2024) (Unit: USD 100 million)
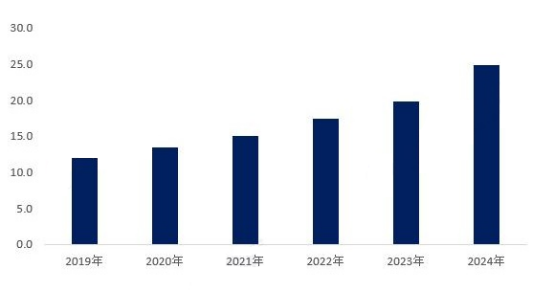 Source: Grand View Research, World BusinessPlan
According to data from Precedence Research, in the global brain-computer interface market in 2024, segmented by product, non-invasive brain-computer interfaces are the largest product category, accounting for 82%. This is followed by invasive brain-computer interfaces, which account for 10%. Finally, semi-invasive brain-computer interfaces account for 8%.
Chart 3: Global Brain-Computer Interface Market Revenue Structure in 2024 (by Product Segment)
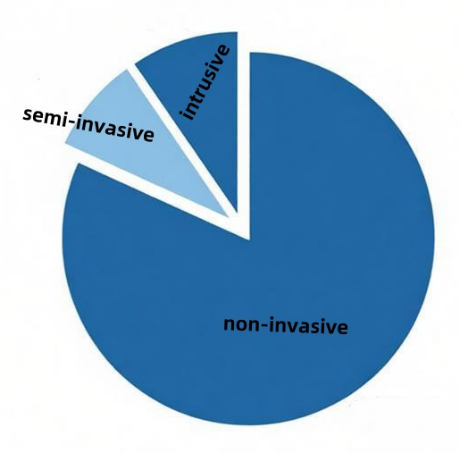 Source: Precedence Research, World BusinessPlan
In 2024, non-invasive products demonstrated their current dominant position with an absolute market share of 82%. The main reasons are:
(1) Safety and accessibility — laying the foundation for commercialization:
The non-invasive nature greatly lowers the barrier to use and psychological resistance for users, creating the necessary conditions for large-scale commercial applications. At the same time, the convenience of non-invasive devices further strengthens their market competitiveness. Non-invasive brain-computer interfaces are relatively safer, more portable, have greater usage potential, and apply to a broader population. Users do not need to bear surgical risks; they can achieve brain-computer interaction simply by wearing a head-mounted device, which significantly expands the potential user base.
(2) Technical characteristics — performance as the key to breaking bottlenecks:
Traditionally, non-invasive brain-computer interfaces have been limited by low signal resolution. The attenuation effect of the scalp and skull on EEG signals results in a much lower signal-to-noise ratio compared to invasive devices. However, in recent years, advances in materials, sensing technologies, and algorithms are gradually addressing this challenge. In 2023, the neuroengineering team at Tianjin University in China developed a 216-command high-speed non-invasive brain-computer interface system, setting a world record for the largest command set in non-invasive BCIs to date. It achieved a new encoding paradigm of “time-frequency-phase hybrid multiple access.” The system maintains an average online information transfer rate of over 300 bits/min, with an average output time per command of only 1.2 seconds, significantly improving the performance boundaries of non-invasive BCIs.
(3) Commercialization pathways — diversified expansion from medical to consumer markets:
In the commercialization process, non-invasive brain-computer interfaces demonstrate stronger adaptability to application scenarios and rapid iteration potential.
The medical rehabilitation field has become an important breakthrough for the early commercialization of non-invasive technology. Considering the clear clinical demand for motor rehabilitation, products face lower certification difficulty and faster approval timelines (BCIs used for rehabilitation training mostly adopt non-invasive approaches, which require shorter technical validation and regulatory approval compared to invasive ones), and have broader application scenarios (hospitals, communities, and home settings).
The launch of the consumer market has further solidified the dominance of non-invasive products. BrainCo, through independently developed dry electrode sensors and high-precision algorithms, has achieved real-time brain-computer interaction without surgery. Its educational EEG devices hold a relatively high market share and are used across multiple schools and training institutions.
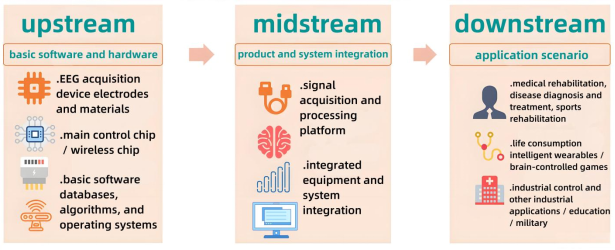
III. Analysis of Upstream and Downstream of the Industry
Upstream: Core components and algorithms are the technological foundation — mainly including electrodes, chips, algorithms, and other key components, which are crucial in determining the performance of brain-computer interfaces;
Midstream: Multiple technological routes advance in parallel, with flourishing system integration — system integration and software-hardware platforms serve as the hub of the industry;
Downstream: Led by healthcare, application scenarios continue to expand — downstream applications represent the ultimate realization of the value of brain-computer interface technology. Currently, healthcare is the primary focus, with gradual penetration into the consumer market.
 Source: World BusinessPlan
IV. Number of Global Brain-Computer Interface Industry Companies
The global prevalence of migraine exceeds 10%, with more than 6 million people dying from stroke each year, over 50 million epilepsy patients, and 47.5 million dementia patients, of whom 60%–70% suffer from Alzheimer's disease. All of these conditions can lead to damage to brain structure and a decline in function, thereby causing impairments in cognition and memory. Brain-computer interfaces represent a new paradigm combining neuroscience and information technology, and may help these patients—and even humanity as a whole—transcend biological limitations.
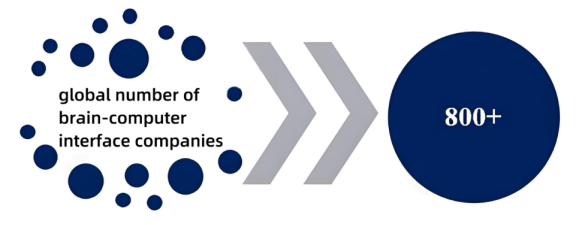
At present, there are more than 800 brain-computer interface companies worldwide, mainly concentrated in the United States and China. In terms of business focus, nearly 80% of companies are engaged in the research and development of non-invasive brain-computer interfaces, while about 20% focus on invasive approaches, often with higher concentration.
Figure 4: Number of Global Brain-Computer Interface Companies as of 2024 (Unit: companies)
 Source: Academy of Information and Communications Technology, World BusinessPlan
V. Global Brain-Computer Interface Market Development Prospects
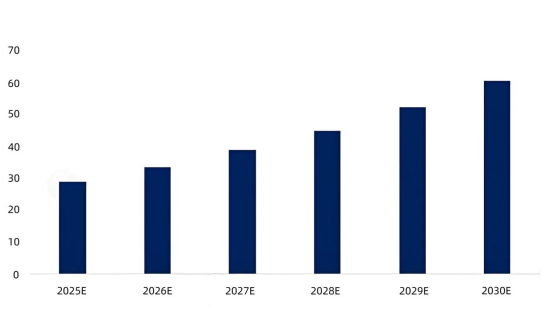
Brain-computer interface (BCI) technology is transforming human destiny with its unique appeal, demonstrating broad application prospects in fields such as healthcare, rehabilitation, and entertainment. At the same time, the capital market has shown strong interest in the BCI industry, with numerous investment institutions and companies investing funds and resources to drive its rapid development. Taking into account forecasts from institutions such as Grand View Research (2023–2030 CAGR 17.5%), SM Research (2021–2030 CAGR 15.11%), and Precedence Research (2023–2033 CAGR 16.55%) on the future development of the global BCI market, it is estimated that the compound annual growth rate of the global BCI market will be approximately 16% from 2025 to 2030, reaching USD 6 billion by 2030.
Figure 5: Forecast of Global Brain-Computer Interface Market Size from 2025 to 2030 (Unit: USD 100 million)
 Source: World BusinessPlan
Table of Contents of the Report on the Development Prospects and Investment Opportunities of the Global and U.S. Brain-Computer Interface (BCI) Industry from 2026 to 2030
Overview Section
Chapter 1: Overview / Industry Profile / Research Description of the Brain-Computer Interface Industry
- 1.1 Overview of the Brain-Computer Interface Industry
- 1.1.1 Definition of Brain-Computer Interface
- 1. Definition of Brain-Computer Interface
- 2. Parameters of Brain-Computer Interface
- 1.1.2 Classification of Brain-Computer Interfaces
- 1.1.3 Industry Position of Brain-Computer Interfaces
- 1.1.4 Market Regulation of Brain-Computer Interfaces
- 1.1.5 Standards and Specifications for Brain-Computer Interfaces
- 1.2 Industry Profile of Brain-Computer Interfaces
- 1.2.1 Schematic Diagram of the BCI Industry Chain Structure
- 1.2.2 Panorama of the BCI Industry Chain Ecosystem
- 1.2.3 Regional Heat Map of the BCI Industry Chain
- 1.3 Research Description of Brain-Computer Interfaces
- 1.3.1 Scope Definition of This Report
- 1.3.2 Authoritative Data Sources of This Report
- 1.3.3 Research Statistical Methods of This Report
Current Situation Section
Chapter 2: Overview of Global Brain-Computer Interface Industry Development and Lessons Learned
- 2.1 Development History/Environment of Global Brain-Computer Interfaces
- 2.1.1 Development History/Stages of Global Brain-Computer Interfaces
- 2.1.2 Summary of Global Brain-Computer Interface Policies/Plans
- 2.1.3 Brain-Computer Interface Research Programs/Funding in Various Countries
- 1. Major Countries’ Brain-Computer Interface Research Programs
- 2. U.S. Brain Initiative (BRAIN Initiative)
- 3. Japan Brain/MINDS Program (Brain/MINDS)
- 2.1.4 Technical Level/Current Status of Global Brain-Computer Interfaces
- 1. Number of Global Brain-Computer Interface Patents
- 2. Major Global Brain-Computer Interface Applicants
- 2.2 Global Brain-Computer Interface Market Size/Scale
- 2.3 Global Brain-Computer Interface Enterprise Layout/Competition
- 2.3.1 Number/Layout of Global Brain-Computer Interface Enterprises
- 2.3.2 Regional Structure/Tiers of Global Brain-Computer Interfaces
- 2.3.3 Business Layout of Global Brain-Computer Interface Enterprises
- 2.3.4 Technology/Layout Enterprises in Global Brain-Computer Interfaces
- 2.3.5 Distribution of Competitive Tiers in Global Brain-Computer Interfaces
- 2.3.6 Competitive Landscape of the Global Brain-Computer Interface Market
- 2.3.7 Financing Situation of Global Brain-Computer Interface Enterprises
- 2.3.8 M&A Transaction Trends in Global Brain-Computer Interfaces
- 2.4 Overview of Global Brain-Computer Interface Submarkets
- 2.4.1 Structure of Global Brain-Computer Interface Submarkets
- 2.4.2 Current Status of Global Brain-Computer Interface Submarkets
- 2.4.3 Downstream Demand Structure of Global Brain-Computer Interfaces
- 2.4.4 Current Status of Downstream Markets for Global Brain-Computer Interfaces
- 2.5 Lessons Learned from Overseas Brain-Computer Interface Development
- 2.6 Forecast of Global Brain-Computer Interface Market Prospects
- 2.7 Insights into Global Brain-Computer Interface Development Trends
Chapter 3: Current Development Status and Challenges of the U.S. Brain-Computer Interface Industry
- 3.1 Development history/stages of brain-computer interfaces in the U.S.
- 3.2 Market size/scale of brain-computer interfaces in the U.S.
- 3.3 Types/number of brain-computer interface companies in the U.S.
- 3.3.1 Market entry barriers/qualification requirements for brain-computer interfaces in the U.S.
- 3.3.2 Types of market participants in the U.S. brain-computer interface market
- 3.3.3 Changes in the number of brain-computer interface companies in the U.S.
- 3.3.4 Entry modes of brain-computer interface companies in the U.S.
- 3.3.5 Entry progress of brain-computer interface companies in the U.S.
- 3.4 R&D funding/financing of brain-computer interfaces in the U.S.
- 3.4.1 Sources of R&D funding for brain-computer interfaces in the U.S.
- 3.4.2 R&D resource support for brain-computer interfaces in the U.S.
- 3.4.3 Financing situation of brain-computer interface companies in the U.S.
- 1. Financing events of U.S. brain-computer interface companies
- 2. Financing scale of U.S. brain-computer interface companies
- 3. Popular financing tracks in U.S. brain-computer interfaces
- 4. Distribution of financing rounds in U.S. brain-computer interfaces
- 5. Distribution of popular financing in U.S. brain-computer interfaces
- 3.5 Clinical trials/progress of brain-computer interfaces in the U.S.
- 3.6 Approved and marketed brain-computer interface products in the U.S.
- 3.7 Technology/layout of U.S. brain-computer interface companies
- 3.7.1 Technology routes of U.S. brain-computer interface companies
- 3.7.2 Technology coverage of U.S. brain-computer interface companies
- 3.7.3 R&D and production models of U.S. brain-computer interface companies
- 3.8 Mass production/industrialization progress of brain-computer interfaces in the U.S.
- 3.9 Service pricing/medical insurance reimbursement for brain-computer interfaces in the U.S.
- 3.10 Procurement situation of brain-computer interfaces in the U.S.
- 3.11 Profitability of U.S. brain-computer interface companies
- 3.12 Pain points and challenges in the development of brain-computer interfaces in the U.S.
Chapter 4: Competitive Landscape and Investment & Financing in the U.S. Brain-Computer Interface Market
- 4.1 Analysis of competitors in the U.S. brain-computer interface industry
- 4.1.1 Degree of competition among existing competitors in the U.S. brain-computer interface market:
- 4.1.2 Threat of entry by potential competitors in the U.S. brain-computer interface market:
- 4.1.3 Competitive threat from substitute product providers in the U.S. brain-computer interface market:
- 4.2 Judgment of market structure in the U.S. brain-computer interface industry
- 4.2.1 Market concentration (CRn) in the U.S. brain-computer interface industry
- 4.2.2 Degree of product differentiation in the U.S. brain-computer interface industry
- 4.2.3 Lifecycle stage of the U.S. brain-computer interface industry:
- 4.3 Competitive posture matrix of the U.S. brain-computer interface industry
- 4.3.1 Key success factors (KSF) for U.S. brain-computer interface companies
- 4.3.2 Competitive posture of competitors in the U.S. brain-computer interface industry:
- 4.3.3 Strategic groups of competitors in the U.S. brain-computer interface industry
- 4.4 Distribution of competitive tiers in the U.S. brain-computer interface market
- 4.5 Analysis of the competitive landscape in the U.S. brain-computer interface market
- 4.6 U.S. brain-computer interfaces vs. China brain-computer interfaces
- 4.7 Investment and M&A trends of U.S. brain-computer interface companies
- 4.7.1 Investment layout of U.S. brain-computer interface companies
- 4.7.2 Mergers and acquisitions of U.S. brain-computer interface companies
Chapter 5: Technological Progress and Supply Chain Status of Brain-Computer Interfaces in the U.S.
- 5.1 Entry barriers and core competitiveness of brain-computer interfaces
- 5.1.1 Technical barriers/entry barriers of brain-computer interfaces
- 5.1.2 Core competitiveness/moats of brain-computer interfaces
- 5.2 R&D investment and technological capabilities of brain-computer interfaces
- 5.2.1 R&D investment intensity/effort of brain-computer interface companies
- 5.2.2 Number/proportion of R&D personnel in brain-computer interface companies
- 5.2.3 Intellectual property statistics/patent applications for brain-computer interfaces
- 1. Changes in the number of brain-computer interface patent applications
- 2. Number of patents in popular brain-computer interface technologies
- 3. Patent counts by applicant for brain-computer interfaces
- 5.2.5 Talent gap/talent cultivation in brain-computer interfaces
- 5.3 Key technologies and new productive forces of brain-computer interfaces
- 5.3.1 Production process flow of brain-computer interfaces
- 5.3.2 Panorama of brain-computer interface technology routes
- 5.3.3 Analysis of brain-computer interface technical principles
- 5.3.4 Key core technologies/difficulties of brain-computer interfaces
- 1. Analysis of acquisition technologies
- 2. Analysis of stimulation technologies
- 3. Analysis of paradigm encoding technologies
- 4. Analysis of decoding algorithm technologies
- 5.4 Production costs and supply chain status of brain-computer interfaces
- 5.4.1 [Basic structure] System composition structure of brain-computer interfaces
- 5.4.2 [Cost control] Production cost structure of brain-computer interfaces
- 5.4.3 [Initial investment] Capital investment in brain-computer interface projects
- 5.4.4 [Supply chain status] Current state of the brain-computer interface supply chain
- 5.5 Supporting supply chain: brain-computer interface electrodes/biocompatible materials
- 5.5.1 Overview of brain-computer interface electrodes
- 5.5.2 Market overview of brain-computer interface electrodes
- 5.5.3 Supplier landscape of brain-computer interface electrodes
- 5.5.4 Domestic/self-sufficient supply of brain-computer interface electrodes
- 5.6 Supporting supply chain: brain-computer interface chips
- 5.6.1 Overview of brain-computer interface chips
- 5.6.2 Market overview of brain-computer interface chips
- 5.6.3 Development process of brain-computer interface chips in the U.S.
- 5.6.4 Brain-computer interface chips — BCI chips
- 1. Overview of BCI chip demand
- 2. Core data of BCI chips
- 3. Supplier landscape of BCI chips
- 5.6.5 Brain-computer interface chips — BLE chips
- 5.7 Supporting supply chain: EEG acquisition equipment
- 5.7.1 Overview of EEG acquisition equipment
- 5.7.2 Approved and marketed EEG acquisition equipment products
- 5.7.3 Supplier landscape of EEG acquisition equipment
- 5.7.4 Localization progress of EEG acquisition equipment
- 5.8 Supporting supply chain: brain-computer interface software/signal processing algorithms
- 5.8.1 Overview of brain-computer interface software
- 5.8.2 Brain-computer interface signal processing algorithms
- 5.8.3 Neural signal acquisition and analysis platforms
Chapter 6: Analysis of the Development of Segmented Brain-Computer Interface Product Markets in the United States
- 6.1 Comprehensive Comparison of Segmented Brain-Computer Interface Technologies
- 6.2 Current Development Status of Segmented Brain-Computer Interface Markets
- 6.3 Structural Analysis of Segmented Brain-Computer Interface Markets
- 6.4 Brain-Computer Interface Technology Path: Invasive Brain-Computer Interfaces
- 6.4.1 Overview of Invasive Brain-Computer Interfaces
- 6.4.2 Companies Deploying Invasive Brain-Computer Interfaces
- 6.4.3 Industrialization Status of Invasive Brain-Computer Interfaces
- 6.4.4 Competitiveness Analysis of Invasive Brain-Computer Interfaces
- 6.4.5 Market Size Estimation of Invasive Brain-Computer Interfaces
- 6.5 Brain-Computer Interface Technology Path: Non-Invasive Brain-Computer Interfaces
- 6.5.1 Overview of Non-Invasive Brain-Computer Interfaces
- 6.5.2 Companies Deploying Non-Invasive Brain-Computer Interfaces
- 6.5.3 Industrialization Status of Non-Invasive Brain-Computer Interfaces
- 6.5.4 Competitiveness Analysis of Non-Invasive Brain-Computer Interfaces
- 6.5.5 Market Size Estimation of Non-Invasive Brain-Computer Interfaces
- 6.6 Brain-Computer Interface Technology Path: Interventional/Semi-Invasive Brain-Computer Interfaces
- 6.6.1 Overview of Interventional/Semi-Invasive Brain-Computer Interfaces
- 6.6.2 Companies Deploying Interventional/Semi-Invasive Brain-Computer Interfaces
- 6.6.3 Industrialization Status of Interventional/Semi-Invasive Brain-Computer Interfaces
- 6.6.4 Competitiveness Analysis of Interventional/Semi-Invasive Brain-Computer Interfaces
- 6.6.5 Market Size Estimation of Interventional/Semi-Invasive Brain-Computer Interfaces
- 6.7 Supporting Hardware for Brain-Computer Interfaces: External Communication/Control Devices & Receiving Devices
- 6.7.1 Brain-Controlled Exoskeletons
- 6.7.2 Brain-Controlled Neuroprosthetics
- 6.7.3 Brain-Controlled AR/VR
- 6.8 Strategic Position Analysis of Segmented Brain-Computer Interface Markets
Chapter 7: Demand Analysis of Segmented Brain-Computer Interface Application Scenarios in the United States
- 7.1 Characteristics of Segmented Brain-Computer Interface Application Demand
- 7.1.1 Downstream Application Scenarios of Brain-Computer Interfaces in the United States
- 7.1.2 Characteristics of Downstream Demand for Brain-Computer Interfaces in the United States
- 7.1.3 Types of Downstream Customers for Brain-Computer Interfaces in the United States
- 7.2 Current Status of Segmented Brain-Computer Interface Application Markets
- 7.3 Distribution of Segmented Brain-Computer Interface Application Fields
- 7.4 Potential Application Scenarios of Brain-Computer Interfaces: Neurological Diseases/Brain Injuries
- 7.4.1 Overview of Brain-Computer Interface Applications in Neurological Diseases/Brain Injuries
- 7.4.2 Companies Deploying Brain-Computer Interfaces in Neurological Diseases/Brain Injuries
- 7.4.3 Current Demand Status for Brain-Computer Interfaces in Neurological Diseases/Brain Injuries
- 1. Core Data on Neurological Diseases/Brain Injuries
- 2. Demand Analysis of Brain-Computer Interfaces for Neurological Diseases/Brain Injuries
- 7.4.4 Demand Potential of Brain-Computer Interfaces in Neurological Diseases/Brain Injuries
- 1. Market Size Estimation for Neurological Diseases/Brain Injuries
- 2. Demand Potential of Brain-Computer Interfaces for Neurological Diseases/Brain Injuries
- 7.5 Potential Application Scenarios of Brain-Computer Interfaces: Medical Diagnosis and Rehabilitation
- 7.5.1 Overview of Brain-Computer Interface Demand in Medical Diagnosis and Rehabilitation
- 7.2.2 Analysis of Brain-Computer Interface Application Fields in the U.S. Healthcare Sector
- 1. Applications of Brain-Computer Interfaces in Monitoring and Diagnosis
- 3. Applications of Brain-Computer Interfaces in Clinical Rehabilitation
- 4. Applications of Brain-Computer Interfaces in Health Management and Disease Prevention
- 7.5.2 Companies Deploying Brain-Computer Interfaces in Medical Diagnosis and Rehabilitation
- 7.5.3 Current Demand Status for Brain-Computer Interfaces in Medical Diagnosis and Rehabilitation
- 1. Core Data on Medical Diagnosis and Rehabilitation
- 2. Demand Analysis of Brain-Computer Interfaces for Medical Diagnosis and Rehabilitation
- 7.5.4 Demand Potential of Brain-Computer Interfaces in Medical Diagnosis and Rehabilitation
- 1. Market Size Estimation for Medical Diagnosis and Rehabilitation
- 2. Demand Potential of Brain-Computer Interfaces for Medical Diagnosis and Rehabilitation
- 7.6 Potential Application Scenarios of Brain-Computer Interfaces: Consumer Entertainment and Smart Home
- 7.6.1 Overview of Brain-Computer Interface Demand in Consumer Entertainment and Smart Home
- 7.6.2 Companies Deploying Brain-Computer Interfaces in Consumer Entertainment and Smart Home
- 7.6.3 Current Demand Status for Brain-Computer Interfaces in Consumer Entertainment and Smart Home
- 1. Core Data on Consumer Entertainment and Smart Home
- 2. Demand Analysis of Brain-Computer Interfaces for Consumer Entertainment and Smart Home
- 7.6.4 Demand Potential of Brain-Computer Interfaces in Consumer Entertainment and Smart Home
- 1. Market Size Estimation for Consumer Entertainment and Smart Home
- 2. Demand Potential of Brain-Computer Interfaces for Consumer Entertainment and Smart Home
- 7.7 Potential Application Scenarios of Brain-Computer Interfaces: Industrial Control/Industrial Robots
- 7.7.1 Overview of Brain-Computer Interface Demand in Industrial Control
- 7.7.2 Companies Deploying Brain-Computer Interfaces in Industrial Control
- 7.7.3 Current Demand Status for Brain-Computer Interfaces in Industrial Control
- 1. Core Data on Industrial Control
- 2. Demand Analysis of Brain-Computer Interfaces for Industrial Control
- 7.7.4 Demand Potential of Brain-Computer Interfaces in Industrial Control
- 1. Market Size Estimation for Industrial Control
- 2. Demand Potential of Brain-Computer Interfaces for Industrial Control
- 7.8 Potential Application Scenarios of Brain-Computer Interfaces: Others
- 7.8.1 Education and Training
- 7.8.2 Assisted Driving
- 7.9 Strategic Position Analysis of Segmented Brain-Computer Interface Applications
Chapter 8: Case Analysis of Typical Global and U.S. Brain-Computer Interface Companies
- 8.1 Overview and Comparison of Global and U.S. Brain-Computer Interface Companies
- 8.2 Case Analysis of Global Brain-Computer Interface Companies (in no particular order, can be specified)
- 8.2.1 Neuralink (USA) / PRIME robotic implantation system
- 1. Basic company information and development history
- 2. Company operations and investment & financing
- 3. Company brain-computer interface product R&D / technology layout
- 4. Company brain-computer interface approval and commercialization progress
- 8.2.2 Synchron (USA) / Stentrode T stent electrode implanted via jugular vein
- 1. Basic company information and development history
- 2. Company operations and investment & financing
- 3. Company brain-computer interface product R&D / technology layout
- 4. Company brain-computer interface approval and commercialization progress
- 8.2.3 NextMind (France) / VISIO head-mounted device
- 1. Basic company information and development history
- 2. Company operations and investment & financing
- 3. Company brain-computer interface product R&D / technology layout
- 4. Company brain-computer interface approval and commercialization progress
- 8.2.4 OpenBCI (USA) / Galea platform integrating EEG/fNIRS multimodal sensing
- 1. Basic company information and development history
- 2. Company operations and investment & financing
- 3. Company brain-computer interface product R&D / technology layout
- 4. Company brain-computer interface approval and commercialization progress
- 8.2.5 Precision Neuroscience (USA)
- 1. Basic company information and development history
- 2. Company operations and investment & financing
- 3. Company brain-computer interface product R&D / technology layout
- 4. Company brain-computer interface approval and commercialization progress
Chapter 9: U.S. Brain-Computer Interface Industry Policy Environment / PEST / SWOT
- 9.1 Summary and Interpretation of U.S. Brain-Computer Interface Industry Policies (P)
- 9.1.1 Summary of U.S. Brain-Computer Interface Industry Policies
- 9.1.2 Development Plans for the U.S. Brain-Computer Interface Industry
- 9.1.3 Interpretation of Key U.S. Brain-Computer Interface Policies
- 9.1.4 State-Level Brain-Computer Interface Industry Policy Planning
- 9.2 Analysis of the U.S. Brain-Computer Interface Industry Economic Environment (E)
- 9.3 Analysis of the U.S. Brain-Computer Interface Industry Social Environment (S)
- 9.4 Summary of the U.S. Brain-Computer Interface Industry PEST Environment
- 9.5 SWOT Analysis Chart of the U.S. Brain-Computer Interface Industry
Chapter 10: Development Potential and Future Outlook of the U.S. Brain-Computer Interface Industry
- 10.1 Assessment of the Development Potential of the U.S. Brain-Computer Interface Industry
- 10.2 Key Future Growth Drivers of the U.S. Brain-Computer Interface Industry
- 10.2.1 Strengthening Fundamental Software and Hardware Capabilities
- 1. Innovating brain signal sensing components
- 2. Breaking through key brain-computer chips
- 3. Consolidating the software tool foundation
- 10.2.2 Building High-Performance Products
- 1. Accelerating breakthroughs in implantable device R&D
- 2. Promoting mass production and iteration of non-implantable devices
- 3. Developing auxiliary devices
- 10.2.3 Expansion of Application Scenarios
- 10.3 Forecast of the Development Prospects of the U.S. Brain-Computer Interface Industry
- 10.4 Insights into Development Trends of the U.S. Brain-Computer Interface Industry
- 10.4.1 Overall Development Trends of the U.S. Brain-Computer Interface Industry
- 10.4.2 Trends in Submarkets of the U.S. Brain-Computer Interface Industry
- 10.4.3 Technological Innovation Trends in the U.S. Brain-Computer Interface Industry
- 10.4.4 Market Competition Trends in the U.S. Brain-Computer Interface Industry
- 10.4.5 Market Supply and Demand Trends in the U.S. Brain-Computer Interface Industry
Chapter 11: Development Opportunities and Strategic Recommendations for the U.S. Brain-Computer Interface Industry
- 11.1 Investment Risk Warnings for the U.S. Brain-Computer Interface Industry
- 11.1.1 Investment Risk Warnings for the U.S. Brain-Computer Interface Industry
- 11.1.2 Countermeasures for Investment Risks in the U.S. Brain-Computer Interface Industry
- 11.2 Analysis of Investment Opportunities in the U.S. Brain-Computer Interface Industry — Full Industry Chain Support
- 11.2.1 Gaps: Investment opportunities in weak points of the brain-computer interface industry chain
- 11.2.2 Deficiencies: Investment opportunities in blank areas of the brain-computer interface industry chain
- 11.3 Analysis of Investment Opportunities in the U.S. Brain-Computer Interface Industry — Subsector Layout
- 11.3.1 Midstream: Layout opportunities for segmented products/services in brain-computer interfaces
- 11.3.2 Downstream: Layout opportunities for segmented applications/scenarios in brain-computer interfaces
- 11.4 Analysis of Investment Opportunities in the U.S. Brain-Computer Interface Industry — Advantageous Regional Layout
- 11.5 Evaluation of Investment Value in the U.S. Brain-Computer Interface Industry
- 11.6 Investment Strategy Recommendations for the U.S. Brain-Computer Interface Industry
- 11.7 Recommendations for Sustainable Development of the U.S. Brain-Computer Interface Industry
List of Figures
Figure 1: Definition of Brain-Computer Interface
Figure 2: Illustration of Brain-Computer Interface
Figure 3: Key Indicators of Brain-Computer Interface Systems
Figure 4: Classification Table of Brain-Computer Interfaces
Figure 5: Classification Diagram of Brain-Computer Interfaces
Figure 6: Classification of Brain-Computer Interfaces Based on Degree of Brain Invasiveness
Figure 7: Classification of Brain-Computer Interfaces Based on Functional Implementation
Figure 8: Industries Involving Brain-Computer Interfaces
Figure 9: Market Regulatory System for Brain-Computer Interfaces
Figure 10: Functions of Brain-Computer Interface Regulatory Agencies
Figure 11: Development of Brain-Computer Interface Standards System in the United States
Figure 12: Summary of Current Brain-Computer Interface Standards
Figure 13: Summary of Current Brain-Computer Interface Standards
Figure 14: Schematic Diagram of Brain-Computer Interface Industry Chain Structure
Figure 15: Panoramic View of Brain-Computer Interface Industry Chain Ecosystem
Figure 16: Regional Heatmap of Brain-Computer Interface Industry Chain
Figure 17: Regional Distribution Heatmap of U.S. Brain-Computer Interface Industry Competitors in 2025
Figure 18: Definition of the Research Scope of This Report
Figure 19: Authoritative Data Sources of This Report
Figure 20: Statistical Research Methods of This Report
Figure 21: Global Development History/Stages of Brain-Computer Interfaces
Figure 22: Key National Research Programs on Brain-Computer Interfaces Worldwide
Figure 23: Brain and Neuroscience Projects Laid Out by U.S. DARPA
Figure 24: Global Brain-Computer Interface Patent Applications and Authorizations (2014–2025) (Units: items, %)
Figure 25: Top 10 Global Brain-Computer Interface Patent Applicants as of 2025 (Units: items)
Figure 26: Large Global Brain-Computer Interface Market Size/Scale
Figure 27: Global Brain-Computer Interface Market Size (2019–2025) (Units: USD 100 million)
Figure 28: Number of Global Brain-Computer Interface Companies as of 2025 (Units: companies)
Figure 29: Business Layout of Global Brain-Computer Interface Companies as of 2025 (Units: %)
Figure 30: Global Regional Development Pattern of Brain-Computer Interfaces
Figure 31: Top 10 Countries of Patent Technology Origin in the Global Brain-Computer Interface Industry as of 2025 (Units: items)
Figure 32: Global Regional Competitive Tiers of Brain-Computer Interfaces
Figure 33: Business Layout of Global Brain-Computer Interface Companies
Figure 34: Business List of Global Brain-Computer Interface Companies
Figure 35: Overview of Global and U.S. Brain-Computer Interface Company Layout
Figure 36: Global Brain-Computer Interface Technology/Layout Companies
Figure 37: Distribution of Global Brain-Computer Interface Competitive Tiers
Figure 38: Global Brain-Computer Interface Market Competitive Landscape
Figure 39: Global Brain-Computer Interface Financing Situation
Figure 40: Global Brain-Computer Interface M&A Trends
Figure 41: Structure of Global Brain-Computer Interface Submarkets
Figure 42: Global Brain-Computer Interface Market Revenue Structure by Product (2025) (Units: %)
Figure 43: Current Status of Global Brain-Computer Interface Submarkets
Figure 44: Comparison of Global Brain-Computer Interface Application Market Structures
Figure 45: Global Brain-Computer Interface Market Revenue Structure by Application Field (2025) (Units: %)
Figure 46: Current Status of Downstream Global Brain-Computer Interface Markets
Figure 47: Lessons from International Brain-Computer Interface Development
Figure 48: Forecast of Global Brain-Computer Interface Market Prospects (2026–2030)
Figure 49: Forecast of Global Brain-Computer Interface Market Growth Potential (2026–2030)
Figure 50: Insights into Global Brain-Computer Interface Development Trends
Figure 51: Development History of the U.S. Brain-Computer Interface Industry
Figure 52: Large U.S. Brain-Computer Interface Market Size/Scale
Figure 53: Qualification Requirements for U.S. Brain-Computer Interface Enterprises
Figure 54: Types of Participants in the U.S. Brain-Computer Interface Market
Figure 55: Changes in the Number of U.S. Brain-Computer Interface Companies
Figure 56: Annual Number of New U.S. Brain-Computer Interface Companies (2014–2025) (Units: companies)
Figure 57: Market Entry Methods of U.S. Brain-Computer Interface Companies
Figure 58: Market Entry Process of U.S. Brain-Computer Interface Companies
Figure 59: Major Research Institutions for U.S. Brain-Computer Interface Technology
Figure 60: Regional Distribution of U.S. Brain Science Research Institutions
Figure 61: Financing Events of U.S. Brain-Computer Interface Companies
Figure 62: Financing Scale of U.S. Brain-Computer Interface Companies
Figure 63: Financing Business Analysis of the U.S. Brain-Computer Interface Industry (2019–2025) (Units: %)
Figure 64: Financing Rounds Analysis of the U.S. Brain-Computer Interface Industry (2015–2025) (Units: %)
Figure 65: Statistics of U.S. Brain-Computer Clinical Experiments (2020–2025) (Units: cases)
Figure 66: Statistics of U.S. Brain-Computer Clinical Trial Stages as of 2025 (Units: cases)
Figure 67: Approved Brain-Computer Interface Products in the U.S.
Figure 68: Technology Routes of U.S. Brain-Computer Interface Companies
Figure 69: Technology Coverage of U.S. Brain-Computer Interface Companies
Figure 70: R&D and Production Models of U.S. Brain-Computer Interface Companies
Figure 71: Service Prices of U.S. Brain-Computer Interfaces
Figure 72: Application Trends and Prospects of Brain-Computer Interfaces in U.S. Healthcare
Figure 73: Overview of U.S. Brain-Computer Interface Procurement
Figure 74: Summary of U.S. Brain-Computer Interface Procurement Events
Figure 75: Statistics of U.S. Brain-Computer Interface Procurement Scale
Figure 76: Procurement Amount and Quantity of the U.S. Brain-Computer Interface Industry (2019–2025) (Units: million USD, units)
Figure 77: Interpretation of U.S. Brain-Computer Interface Tendering and Procurement Data
Figure 78: Regional Tendering and Procurement Volume and Amount in the U.S. Brain-Computer Interface Industry (2019–2025) (Units: units, million USD)
Figure 79: Profitability of U.S. Brain-Computer Interface Companies
Figure 80: Pain Points and Challenges in U.S. Brain-Computer Interface Development
Figure 81: Competitive Intensity Among Existing Competitors in the U.S. Brain-Computer Interface Industry
Figure 82: Threat of New Entrants in the U.S. Brain-Computer Interface Industry
Figure 83: Threat of Substitute Manufacturers in the U.S. Brain-Computer Interface Industry
Figure 84: Market Structure Assessment of the U.S. Brain-Computer Interface Industry
Figure 85: Market Concentration (CRn) of the U.S. Brain-Computer Interface Industry
Figure 86: Degree of Product Differentiation in the U.S. Brain-Computer Interface Industry
Figure 87: Lifecycle Stage of the U.S. Brain-Computer Interface Industry
Figure 88: Key Success Factors (KSF) of the U.S. Brain-Computer Interface Industry
Figure 89: Competitive Situation Among U.S. Brain-Computer Interface Industry Players
Figure 90: Strategic Clusters of Competitors in the U.S. Brain-Computer Interface Industry
Figure 91: Distribution of Competitive Tiers in the U.S. Brain-Computer Interface Industry
Figure 92: Competitive Landscape of the U.S. Brain-Computer Interface Industry
Figure 92: Performance of Foreign Brain-Computer Interface Companies in the U.S. Market
Figure 93: Investment Layout of U.S. Brain-Computer Interface Companies
Figure 94: Mergers and Acquisitions of U.S. Brain-Computer Interface Companies
Figure 95: Technological/Entry Barriers in Brain-Computer Interfaces
Figure 96: Core Competitiveness/Moats of Brain-Computer Interface Companies
Figure 97: R&D Investment Intensity of Brain-Computer Interface Companies
Figure 98: R&D Expenditure of Listed Companies in the U.S. Brain-Computer Interface Industry (2020–2025) (Units: USD 100 million)
Figure 99: Ratio of R&D Expenses to Revenue of Listed Companies in the U.S. Brain-Computer Interface Industry (2020–2025) (Units: %)
Figure 100: Number of R&D Personnel in Brain-Computer Interface Companies
Figure 101: Number of Patent Applications in the U.S. Brain-Computer Interface Industry (2008–2025) (Units: items)
Figure 102: Top 10 Popular Technologies in the U.S. Brain-Computer Interface Industry as of 2025 (Units: items)
Figure 103: Intellectual Property/Patent Applications of Brain-Computer Interfaces
Figure 104: Top 10 Applicants in the U.S. Brain-Computer Interface Industry as of 2025 (Units: items)
Figure 105: Production Process Flowchart of Brain-Computer Interfaces
Figure 106: Schematic Diagram of Brain-Computer Interface Principles
Figure 107: Key Core Technologies/Difficulties of Brain-Computer Interfaces
Figure 108: Adaptive Technology R&D Directions for Stimulation Technologies:
Figure 109: Structural Composition of Brain-Computer Interface Systems
Figure 110: [Cost Control] Production Cost Structure of Brain-Computer Interfaces
Figure 111: [Initial Investment] Capital Investment in Brain-Computer Interface Projects
Figure 112: Current Status and Impact Analysis of the U.S. Brain-Computer Interface Supply Chain
Figure 113: Summary of the Impact of Supporting Industry Layout on the Brain-Computer Interface Industry
Figure 114: Overview of Brain-Computer Interface Electrodes
Figure 115: Functions of Brain-Computer Interface Electrodes
Figure 116: Market Overview of Brain-Computer Interface Electrodes
Figure 117: Overview of Brain-Computer Interface Chips:
Figure 118: Development Progress of Brain-Computer Interface Chips
Figure 119: Overview of BCI Chip Demand
Figure 120: Core Data of BCI Chips
Omitted... For the complete table of contents, please inquire via email.
VI. Our Research Focus:
1. Policy Environment
Conduct a comprehensive and in-depth study of the international and domestic economic environment in which the industry operates, analyze industrial policies and related supporting policy trends, and grasp the development direction of industry policies.
2. Investment Trends
Starting from newly built and ongoing projects of the current year, focus on studying the current state of industry investment and existing issues, providing development strategies and investment recommendations for investors.
3. Market Supply and Demand
Relying on a powerful database, analyze the current market supply and demand through data, provide industry information, and scientifically forecast supply and demand trends for the next 3–5 years.
4. Market Competition
Conduct a comparative analysis of the operational conditions of the top 30 key enterprises in each industry, including production, sales, profitability, as well as their respective business strategies and competitive advantages.
VII. Our Advantages:
1. Abundant Expert and Information Resources
Leveraging proprietary databases and AI large-model systems, we possess rich data resources and have established a distinctive and comprehensive industry monitoring system.
2. Broad Industry Coverage with Strong Targeting
While conducting comprehensive industry analysis, we also perform separate analyses of important sub-sectors or products, offering extensive and highly practical information.
3. Comprehensive Content with Engaging Presentation
The report is based on empirical descriptions using the latest data of the year, featuring rich data and charts to enhance readability and visualization, while avoiding clichés and empty statements.
4. Deep Insight and Foresight
Provide insights into future industry development directions, the evolution of competitive landscapes, as well as technical standards, market size, potential issues, and key bottlenecks in industry development.
5. Creative and Constructive Strategic Recommendations
Analyze and demonstrate investment characteristics, market size, supply and demand conditions, competitive landscape (structure and major competitors), and development trends of the industry or specific products.