
1. U.S. Retail Data:
In January 2026, U.S. retail data declined by 0.2% month-on-month. Winter storms and oil prices were the main drags, also reflecting a normal pullback after the holiday shopping season. In January 2026, U.S. retail sales fell by 0.16% month-on-month, better than the market expectation of -0.3% but lower than the previous value of 0%. Winter storms swept across the central and eastern United States, significantly constraining consumer travel and spending willingness. In addition, declines in automobile sales and gas station sales dragged down overall retail data. The month-on-month decline in January retail data also reflects a typical post-holiday consumption adjustment.
Chart 1: U.S.: Seasonally Adjusted Month-on-Month Retail and Food Services Sales (%)
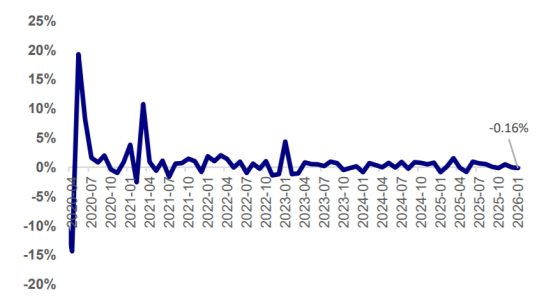 Sources: U.S. Census Bureau, TradingEconomics, World BusinessPlan
Chart 2: U.S.: Retail and Food Services Sales, Seasonally Adjusted Year-on-Year (%)
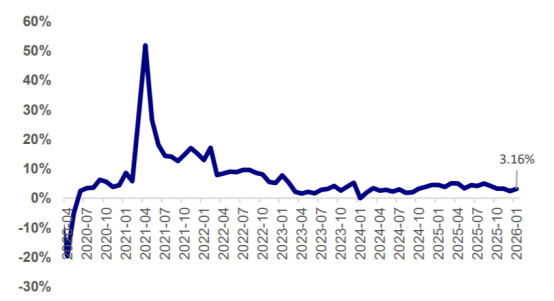 Source: U.S. Census Bureau, TradingEconomics, World BusinessPlan
Tax refunds in the first half of 2026 may boost consumer spending. In terms of the core measure, excluding motor vehicles and parts dealers, retail and food services sales in January increased by +0.01% month-on-month, lower than the previous value of +0.05%.
Figure 3: U.S.: Retail (excluding motor vehicles and parts dealers): Seasonally adjusted: Month-on-month
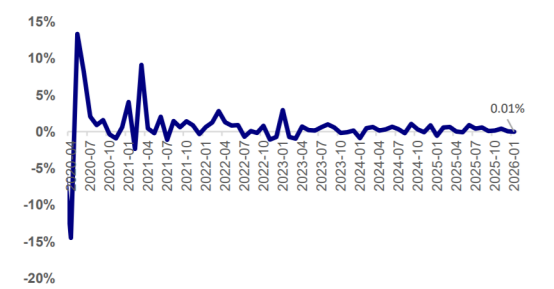 Sources: U.S. Census Bureau, TradingEconomics, World BusinessPlan
Chart 4: United States: Retail (excluding motor vehicles & parts dealers and gasoline stations): Month-on-month
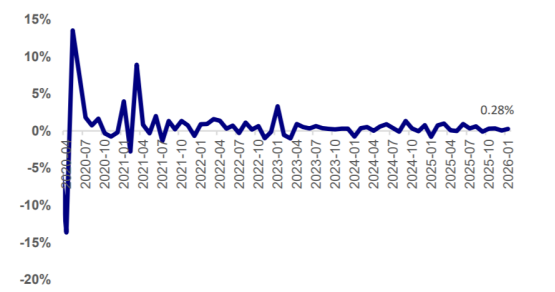 Source: U.S. Census Bureau, TradingEconomics, World BusinessPlan
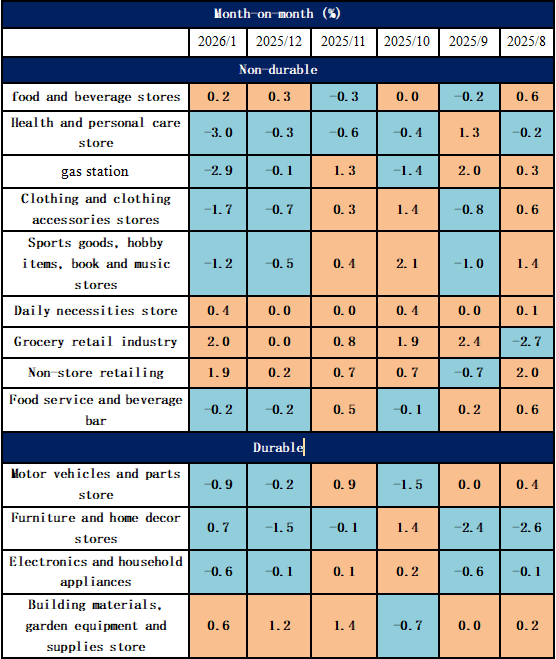
In the January 2026 retail data, performance across 13 sub-sectors diverged, with 7 categories experiencing declines. Health and personal care stores, gas stations, clothing and clothing accessories stores, sporting goods, hobby, book and music stores, food services and drinking places, motor vehicle and parts dealers, and electronics and appliance stores all saw month-on-month decreases of -3.0%, -2.9%, -1.7%, -1.2%, -0.2%, -0.9%, and -0.6%, respectively. Despite overall pressure on retail data, non-store retail sales increased by 1.9% month-on-month in January, indicating that consumers shifted their shopping demand to online channels due to factors such as adverse weather.
Chart 5: Performance of various U.S. retail data in January
 Source: US Bureau of Economic Analysis, TradingEconomics, World BusinessPlan
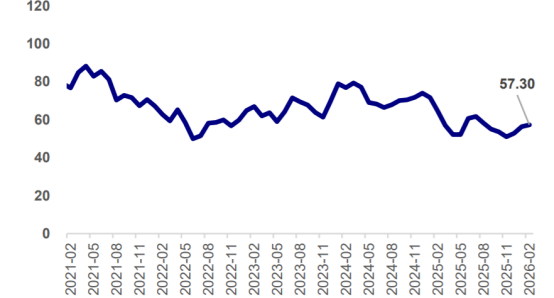
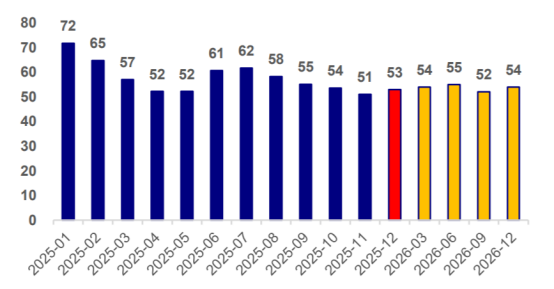
In February 2026, the University of Michigan U.S. Consumer Sentiment Index recorded 57.3, rebounding from 56.4 in January and achieving three consecutive months of increases, reflecting a recovery in U.S. consumers' willingness to spend; however, the current level remains slightly below the full-year average of 57.6 in 2025, so the outlook for the University of Michigan Consumer Sentiment Index remains cautious.
Chart 6: United States: University of Michigan Consumer Sentiment Index (%)
 Data source: University of Michigan, World BusinessPlan
Chart 7: University of Michigan Consumer Sentiment Index for the past 12 months and forecast (%)
 Sources: TradingEconomics, World BusinessPlan
2026–2030 U.S. Retail Industry Market Outlook and Investment Strategic Planning Analysis Report
Overview Section
Chapter 1: Overview of the Retail Industry and Explanation of Data Sources
- 1.1 Definition of the Retail Industry
- 1.1.1 Definition of the Retail Industry
- 1.1.2 Nature and Characteristics of Retail
- 1.1.3 Industry Position of Retail
- 1.1.4 Retail Terminology
- 1.2 Classification of the Retail Industry
- 1.2.1 Main Classification Methods and Reference Basis for Retail
- 1.2.2 Main Retail Formats Classification
- 1.2.3 Main Retail Product Classification
- 1.3 Explanation of the Scope of This Report
- 1.4 Market Regulation & Standards System of the Retail Industry
- 1.4.1 Regulatory System and Institutional Functions of the Retail Industry
- 1.4.2 Standards System and Development Progress of the Retail Industry
- 1. Framework of the Retail Industry Standards System
- 2. Summary of Current & Upcoming Standards in the Retail Industry
- (1) Summary of Current National Standards in the U.S. Retail Industry
- (2) Summary of Current Industry Standards in the U.S. Retail Industry
- (3) Summary of Current Local Standards in the U.S. Retail Industry
- (4) Summary of Current Enterprise Standards in the U.S. Retail Industry
- (5) Summary of Current Group Standards in the U.S. Retail Industry
- 3. Interpretation of Key Standards in the Retail Industry and Their Impact
- 1.5 Explanation of Data Sources and Statistical Standards in This Report
- 1.5.1 Authoritative Data Sources of This Report
- 1.5.2 Research Methods and Statistical Standards Used in This Report
Current Situation
Chapter 2: Current Development Status and Trend Insights of the Global Retail Industry
- 2.1 Development History of the Global Retail Industry
- 2.2 Current Development Status of the Global Retail Industry
- 2.2.1 Technological Progress in the Global Retail Industry
- 1. Application of Big Data in the Retail Industry
- 2. Application of Blockchain in the Retail Industry
- 2.2.2 Overall Situation of the Global Retail Industry
- 1. Explosion of Global Online Shopping Potential
- 2. Online Shopping Effectively Mitigates Store Losses During the Pandemic
- 3. Integrated Omnichannel Business Enhances Shopping Experience
- 2.2.3 Segmented Markets in the Global Retail Industry
- 1. Physical Retail
- 2. Online Retail (E-commerce)
- 2.3 Competitive Landscape of the Global Retail Industry
- 2.3.1 Competitive Landscape of the Global Retail Industry
- 2.3.2 Mergers and Acquisitions in the Global Retail Industry
- 2.4 Regional Development of the Global Retail Industry and Experience Reference
- 2.4.1 Regional Development Pattern of Global Retail
- 1. Regional Distribution of Global Retail Industry Resources
- 2. Regional Patent Applications in the Global Retail Industry
- 2.4.2 Key Regional Markets in Global Retail
- 1. Europe
- (1) Analysis of Europe’s Economic Status
- (2) Current Status of European Consumer Confidence
- (3) Ranking of Major European Retailers
- (4) Development Trends of the European Retail Industry
- 2. China
- (1) Analysis of China’s Economic Status
- (2) Current Status of Chinese Consumer Confidence
- (3) Ranking of Major Chinese Retailers
- (4) Development Trends of China’s Retail Industry
- 3. Japan
- (1) Analysis of Japan’s Economic Status
- (2) Current Status of Japanese Consumer Confidence
- (3) Major Japanese Retailers
- (4) Development Trends of Japan’s Retail Industry
- 2.4.3 Models and Current Trends of Retailers’ Cross-border Development
- 1. Introduction to Modes of Entering Overseas Markets
- 2. Factors to Consider When Entering Overseas Markets
- 3. Current Status and Trends of Retailers’ Cross-border Development
- (1) Current Status of Retailers’ Cross-border Development
- (2) Trends in Retailers’ Cross-border Development
- 2.4.4 Reference from Overseas Retail Development Experience
- 2.5 Market Size and Trend Insights of the Global Retail Industry
- 2.5.1 Market Size of the Global Retail Industry
- 2.5.2 Forecast of the Global Retail Industry Market Outlook
- 2.5.3 Insights into Development Trends of the Global Retail Industry
Chapter 3: Current Development Status and Market Pain Points of the U.S. Retail Industry
- 3.1 Development History of the U.S. Retail Industry
- 3.2 Technological Progress in the U.S. Retail Industry
- 3.2.1 R&D Investment in the Retail Industry
- 3.2.2 R&D Innovation in the Retail Industry
- 3.2.3 Application of Next-Generation Information Technologies in the Retail Industry
- 1. Intelligent Sales Systems
- 2. Retail Data Analysis
- 3. Inventory Management
- 4. Smart Service Kiosks
- 5. Augmented Reality
- 6. Internet of Things
- 3.3 Market Characteristics of the U.S. Retail Industry
- 3.4 Market Participants in the U.S. Retail Industry
- 3.4.1 Types of Retail Market Participants
- 3.4.2 Entry Methods of Retail Enterprises
- 3.4.3 Number of Retail Market Participants
- 3.5 Market Size of the U.S. Retail Industry
- 3.6 Market Development Pain Points of the U.S. Retail Industry
- 3.6.1 The Contradiction Between Rising Operating Costs and Efficiency
- 3.6.2 Urgent Need to Optimize Development Layout
- 3.6.3 Innovation Foundations Still Need Strengthening
- 3.6.4 Inventory Crisis and Solutions to High Inventory Issues
- 3.6.5 The Impact of New Business Models Such as E-commerce on the Industry
Chapter 4: Market Competition, Investment, and Mergers & Acquisitions in the U.S. Retail Industry
- 4.1 Entry and Strategic Layout of Retail Competitors
- 4.1.1 Entry Process of Retail Competitors
- 4.1.2 Regional Distribution Heat Map of Retail Competitors
- 4.1.3 Strategic Layout Status of Retail Competitors
- 4.2 Market Competition Landscape of the Retail Industry
- 4.2.1 Distribution of Retail Competitive Clusters
- 4.2.2 Retail Market Competition Landscape
- 4.2.3 Market Concentration in the Retail Industry
- 4.3 Global Market Competitiveness and Globalization Layout of Retail Enterprises
- 4.4 Analysis of Porter’s Five Forces Model in the Retail Industry
- 4.4.1 Bargaining Power of Suppliers in the Retail Industry
- 4.4.2 Bargaining Power of Consumers in the Retail Industry
- 4.4.3 Threat of New Entrants in the Retail Industry
- 4.4.4 Threat of Substitutes in the Retail Industry
- 4.4.5 Competitive Rivalry Among Existing Firms in the Retail Industry
- 4.4.6 Summary of the Competitive State of the Retail Industry
- 4.5 Investment & Financing, Mergers and Acquisitions, and IPO Dynamics in the Retail Industry
- 4.5.1 Investment and Financing Status in the Retail Industry
- 1. Overview of Investment and Financing in the Retail Industry
- (1) Venture Capital
- (2) Debt Financing
- (3) Internal Financing
- (4) Valuation Adjustment Mechanism (VAM) Agreements
- 2. Investment and Financing Review of the Retail Industry
- 3. Investment and Financing Trends in the Retail Industry
- 4.5.2 Mergers and Acquisitions Dynamics of Retail Enterprises
- 1. Motivations and Methods of Retail M&A
- 2. Summary of Retail M&A Events
- 4. Forecast of Trends in Retail Mergers and Restructuring
- 4.5.3 IPO Dynamics in the Retail Industry
Chapter 5: Market Analysis of Segmented Formats in the U.S. Retail Industry
- 5.1 Current Development Status and Future Trends of Segmented Retail Formats in the U.S.
- 5.1.1 Comparison of Retail Submarkets
- 5.1.2 Structure of Retail Submarkets
- 5.2 E-commerce
- 5.2.1 Overview of the E-commerce Format
- 5.2.2 Current Development Status of the E-commerce Market
- 1. Scale of E-commerce Transactions in the U.S.
- 2. Structure of the U.S. E-commerce Market
- 5.2.3 Development Trends in E-commerce
- 5.3 Shopping Centers
- 5.3.1 Overview of the Shopping Center Format
- 5.3.2 Current Development Status of the Shopping Center Market
- 5.3.3 Development Trends of Shopping Center Retail Formats
- 1. Community-based product lines are mainstream, and chain projects are the future trend
- 2. Department stores and supermarkets are collectively entering commercial real estate, with both opportunities and challenges
- 3. Upgrading experiences and creating more possibilities
- 5.4 Supermarkets
- 5.4.1 Overview of the Supermarket Format
- 5.4.2 Current Development Status of the Supermarket Market
- 5.4.3 Development Trends of Supermarket Retail Formats
- 5.5 Convenience Stores
- 5.5.1 Overview of the Convenience Store Format
- 1. Traditional convenience stores and new digital convenience stores
- 2. Standard convenience stores and unmanned intelligent convenience stores
- 5.5.2 Current Development Status of Convenience Stores
- 1. Number of convenience store outlets in the U.S.
- 2. Population coverage rate of convenience stores in the U.S.
- 3. Sales revenue of convenience stores in the U.S.
- 5.5.3 Development Trends of Convenience Store Retail Formats
- 5.6 Specialty Stores
- 5.6.1 Overview of the Specialty Store Format
- 5.6.2 Overall Development Status of Specialty Stores
- 5.6.3 Analysis of the Development of the Home Appliance Retail Industry
- 1. Current development status of the home appliance retail industry
- 2. Market structure of the home appliance retail industry
- 3. Problems in the home appliance retail industry
- 4. Business model innovation in the home appliance retail industry
- (1) Meisu model
- (2) Huiyin model
- (3) Dashang model
- (4) Shundian model
- 5. Development trends of the home appliance retail industry
- 5.6.4 Analysis of the Development of the Pharmacy Retail Industry
- 1. Current development status of pharmacy retail
- (1) Growth in the number of chain pharmacy enterprises
- (2) Growth in the number of chain pharmacy outlets
- 2. Business models of the pharmaceutical retail industry
- (1) Analysis of directly operated chain model
- (2) Analysis of franchise chain model
- 3. Competition in the pharmacy retail industry
- 4. Development trends of pharmacy retail
- (1) Trends in geographic selection
- (2) Trends in business content
- (3) Trends in competitive approaches
- 5.6.5 Analysis of the Development of the Gold and Jewelry Retail Industry
- 1. Current status of gold and jewelry retail
- 2. Operating models of the gold and jewelry retail industry
- 3. Sales channels of the gold and jewelry retail industry
- (1) Brand-owned operations
- (2) Brand agency
- (3) Brand franchising
- (4) Non-branded wholesale
- (5) E-commerce
- 4. Development trends of the gold and jewelry retail industry
- 5.7 New Retail
- 5.7.1 Overview of the New Retail Format
- 1. What is “new retail”?
- 2. The differences and connections between “new retail” and traditional retail
- 5.7.2 Current Development Status of the New Retail Market
- 5.7.3 Development Trends of New Retail Formats
Chapter 6: Analysis of the Current Development Status and Future Trends of the U.S. Major Commodity Retail Market
- 6.1 Overview of U.S. Commodity Retail Development
- 6.2 Food Category
- 6.2.2 Total Food Retail Sales and Growth Rate
- 6.2.1 Analysis of Food Consumer Prices
- 6.2.3 Analysis of Food Sales Channels
- 6.2.4 Development Trends and Prospects of the Food Retail Market
- 6.3 Apparel Category
- 6.3.1 Total Apparel Retail Sales and Growth Rate
- 6.3.2 Analysis of Apparel Consumer Prices
- 6.3.3 Analysis of Apparel Sales Channels
- 1. Traditional Model
- 2. SPA Model
- (1) Development of the SPA Model
- (2) Characteristics of the SPA Model
- (3) Four Major Modules of SPA
- 3. Virtual Operation Model
- 4. E-commerce Model
- 5. Characteristics of the Apparel Retail Market
- 6.3.4 Development Trends and Prospects of the Apparel Retail Market
- 6.4 Daily Necessities
- 6.4.1 Total Retail Sales and Growth Rate of Daily Necessities
- 6.4.2 Analysis of Sales Channels for Daily Necessities
- 1. Sales channels are concentrated in supermarkets and hypermarkets
- 2. Group buying accounts for a certain proportion of market sales
- 6.4.3 Analysis of Retail Characteristics of Daily Necessities
- 6.4.4 Development Trends and Prospects of the Daily Necessities Retail Market
- 6.5 Cosmetics
- 6.5.1 Total Retail Sales and Growth Rate of Cosmetics
- 6.5.2 Analysis of Cosmetic Consumption Structure
- 6.5.3 Analysis of Cosmetic Sales Channels and Retail Characteristics
- 1. Analysis of Cosmetic Sales Channels
- 2. Analysis of Cosmetic Retail Characteristics
- 6.5.4 Development Trends and Prospects of the Cosmetics Retail Market
- 6.6 Home Appliances
- 6.6.1 Production and Sales of the Home Appliance Market
- 6.6.2 Total Retail Sales of the Home Appliance Market
- 6.6.3 Analysis of Sales Channels and Retail Characteristics of Home Appliances
- 1. Analysis of Sales Channels in the Home Appliance Industry
- 2. Characteristics of the Home Appliance Retail Market
- 6.6.4 Development Trends and Prospects of the Home Appliance Retail Market
- 6.7 Pharmaceuticals
- 6.7.1 Total Retail Sales of the Pharmaceutical Market
- 6.7.2 Structure of Pharmaceutical Consumption
- 6.7.3 Analysis of Pharmaceutical Sales Channels and Retail Characteristics
- 6.7.4 Development Trends and Prospects of the Pharmaceutical Retail Market
- 6.8 Gold and Jewelry
- 6.8.1 Total Retail Sales of the Gold and Jewelry Market
- 6.8.2 Structure of Gold and Jewelry Consumption
- 6.8.3 Analysis of Sales Channels and Retail Characteristics of Gold and Jewelry
- 1. Sales Channels of Gold and Jewelry
- 2. Characteristics of the Gold and Jewelry Retail Market
- 6.8.4 Development Trends and Prospects of the Gold and Jewelry Retail Market
Chapter 7: Analysis of Typical Regional Market Trends and Prospects in the U.S. Retail Industry
- 7.1 Comparison of Regional Development in the U.S. Retail Industry
Chapter 8: Case Studies of Global and U.S. Retail Enterprises
- 8.1 Overview and Comparison of Global and U.S. Retail Enterprises
- 8.2 Case Analysis of Global Retail Enterprises (no particular order, customizable)
- 1. Basic Company Information
- 2. Business Operations
- 3. Regional Markets and U.S. Presence
- (1) Development and Business Expansion in the U.S.
- (2) Store Opening and Closing Situation in the U.S.
- 4. Current Status of “Internet+” Operations
Outlook Section
Chapter 9: Insights into the Development Environment & SWOT Analysis of the U.S. Retail Industry
- 9.1 Analysis of the Economic Environment of the U.S. Retail Industry
- 9.1.1 Current Status of U.S. Macroeconomic Development:
- 1. U.S. GDP growth
- 2. Structure of the three major industries in the U.S.
- 3. Analysis of fixed asset investment
- 9.1.2 Outlook for U.S. Macroeconomic Development:
- 1. Forecasts of U.S. GDP growth by international institutions
- 2. Forecasts of U.S. macroeconomic indicators by domestic institutions
- 9.1.3 Analysis of the Correlation Between the Development of the U.S. Retail Industry and Macroeconomy
- 9.2 Analysis of the Social Environment of the U.S. Retail Industry
- 9.2.1 Social Environment Analysis of the U.S. Retail Industry
- 1. Population and number of internet users in the U.S.
- 2. Disposable income of residents
- 3. Per capita consumption expenditure and consumption structure
- 4. Consumer habits and perceptions
- 9.2.2 Summary of the Impact of the Social Environment on Retail Industry Development
- 9.3 Analysis of the Policy Environment of the U.S. Retail Industry
- 9.3.1 Summary and Interpretation of Retail Industry Policies and Plans at the U.S. Level (Guiding/Supportive/Restrictive)
- 1. Summary and interpretation of retail industry policies at the U.S. level
- (1) Summary of retail industry policies at the U.S. level
- (2) Interpretation of key retail industry policies at the U.S. level
- 2. Summary and interpretation of retail industry plans at the U.S. level
- (1) Summary of retail industry plans at the U.S. level
- (2) Interpretation of key retail industry plans at the U.S. level
- 9.3.2 Summary and Interpretation of Retail Industry Policies and Plans in 31 States (Guiding/Supportive/Restrictive)
- 1. Summary of retail industry policies and plans in 31 states
- 2. Interpretation of retail industry development goals in 31 states
- 9.3.3 Impact of Key U.S. Plans/Policies on Retail Industry Development
- 9.3.4 Summary of the Impact of the Policy Environment on Retail Industry Development
- 9.4 SWOT Analysis of the U.S. Retail Industry (Strengths/Weaknesses/Opportunities/Threats)
Chapter 10: Market Outlook and Development Trends of the U.S. Retail Industry
- 10.1 Assessment of the Development Potential of the U.S. Retail Industry
- 10.2 Analysis of Key Future Growth Drivers of the U.S. Retail Industry
- 10.3 Forecast of the Development Prospects of the U.S. Retail Industry
- 10.4 Outlook on Development Trends of the U.S. Retail Industry
- 10.4.1 Market Competition Trends in the U.S. Retail Industry
- 10.4.2 Technological Innovation Trends in the U.S. Retail Industry
- 1. Application of technologies such as big data, artificial intelligence, and cloud computing promotes industry innovation and development
- 2. Products are moving toward greater intelligence
- 10.4.3 Trends in Sub-segments of the U.S. Retail Industry
- 1. Continuous optimization on the supply side across the industry
- 2. Business formats with stronger service attributes may usher in development opportunities
- 3. Rapid development of new retail and internet retail
- 4. Increasing human-centric nature of community retail
Chapter 11: Investment Strategy Planning and Recommendations for the U.S. Retail Industry
- 11.1 Entry and Exit Barriers in the U.S. Retail Industry
- 11.1.1 Analysis of Entry Barriers in the Retail Industry
- 1. Capital barriers
- 2. Technological barriers
- 3. Market access barriers
- 4. Talent barriers
- 5. Brand barriers
- 11.1.2 Analysis of Exit Barriers in the Retail Industry
- 11.2 Investment Risk Warnings for the U.S. Retail Industry
- 11.3 Analysis of Investment Opportunities in the U.S. Retail Industry
- 11.3.1 Investment Opportunities in Weak Links of the Retail Industry
- 11.3.2 Investment Opportunities in Sub-sectors of the Retail Industry
- 11.3.3 Investment Opportunities in Regional Markets of the Retail Industry
- 11.3.4 Investment Opportunities in Gaps within the Retail Industry
- 11.4 Investment Value Assessment of the U.S. Retail Industry
- 11.5 Investment Strategies and Recommendations for the U.S. Retail Industry
- 11.5.1 Investment Recommendations for Potential Entrants
- 11.5.2 Recommendations for Sustainable Development of the Industry
List of Charts
Chart 1: Definition of Retail
Chart 2: Nature and Characteristics of Retail
Chart 3: Industry of the Research Field Covered in This Report
Chart 4: Retail Terminology
Chart 5: Main Formats of Retail Classification
Chart 6: Main Product Categories in the Retail Industry
Chart 7: Scope Definition of This Report
Chart 8: Regulatory System Structure of the U.S. Retail Industry
Chart 9: Functions of Supervisory Authorities, Industry Associations, and Self-Regulatory Organizations in the U.S. Retail Industry
Chart 10: Framework and Development Progress of the Retail Industry Standards System in 2025 (Unit: items)
Chart 11: Summary of Current National Standards in the Retail Industry as of 2025
Chart 12: Summary of Current Industry Standards in the Retail Industry as of 2025
Chart 13: Summary of Current Local Standards in the Retail Industry as of 2025
Chart 14: Summary of Current Enterprise Standards in the Retail Industry as of 2025
Chart 15: Summary of Current Association Standards in the Retail Industry as of 2025
Chart 16: Key Standards in the Retail Industry and Their Impact Analysis
Chart 17: Summary of Authoritative Data Sources for This Report
Chart 18: Main Research Methods and Statistical Standards Used in This Report
Chart 19: Development History of the Global Retail Industry
Chart 20: Big Data Solutions for the Retail Industry
Chart 21: Cases of Global Retailers Using Big Data
Chart 22: Blockchain Workflow Steps
Chart 23: Diagram of Blockchain Operating Model
Chart 24: Comparison of Blockchain Adoption Rates Between the Consumer Goods Industry and the First Wave of Industries, 2020–2025 (Unit: %)
Chart 25: Proportion of Global Consumers Unwilling to Return to Physical Stores Due to Good Online Shopping Experience in 2025 (Unit: %)
Chart 26: Proportion of Global Enterprises Believing Online Sales Can Offset Losses of Offline Stores During the Pandemic in 2025 (Unit: %)
Chart 27: Proportion of Global Consumers Preferring Omnichannel Retailers in 2025 (Unit: %)
Chart 28: Global Retail Industry Physical Sales Submarket Size and Growth Rate, 2020–2025 (Unit: trillion USD, %)
Chart 29: Global Retail Industry Online Sales Submarket Size and Growth Rate, 2020–2025 (Unit: trillion USD, %)
Chart 30: Growth Rate of E-commerce Retail Sales in Top 10 Countries Globally in 2025 (Unit: %)
Chart 31: Competitive Landscape of the Global Retail Industry in 2025 (Unit: USD 100 million)
Chart 32: Summary of Global Retail Industry Mergers and Acquisitions, 2019–2025
Chart 33: Regional Distribution of Top 250 Global Retail Companies in 2025 (Unit: %)
Chart 34: Number of Global Online Retail Patent Applications, 2011–2025 (Unit: items)
Chart 35: Characteristics of the European Economy
Chart 36: Trend of Total GDP of EU-27, 2013–2025 (Unit: trillion euros, %)
Chart 37: Trend of EU Consumer Confidence Index, 2019–2025 (Unit: %)
Chart 38: European Retailers Ranked Among the Global Top 20 in 2025
Chart 39: Trend of China’s GDP, 2013–2025 (Unit: trillion USD, %)
Chart 40: China Consumer Confidence Index, 2019–2025
Chart 41: Chinese Retailers Ranked Among the Global Top 20 in 2025
Chart 42: Trend of Japan’s GDP, 2013–2025 (Unit: trillion yen, %)
Chart 43: Japan Consumer Confidence Index, 2019–2025
Chart 44: Ranking of Japanese Companies Among the Top 10 of the Global Top 100 Retailers in 2025
Chart 45: Overview of Market Entry Modes for Multinational Retailers
Chart 46: Factors to Consider When Choosing Overseas Market Entry Modes
Chart 47: Influencing Factors for Multinational Retailers in Selecting Overseas Market Entry Modes
Chart 48: Cross-border Development of Retailers in 2025
Chart 49: Lessons from International Retail Development
Chart 50: Analysis of Global Retail Market Size, 2020–2025 (Unit: trillion USD, %)
Chart 51: Forecast of Global Retail Market Size and Outlook, 2025–2030 (Unit: trillion USD)
Chart 52: Insights into Global Retail Industry Trends
Chart 53: Development History of the U.S. Retail Industry
Chart 54: Changes in AI R&D Investment of Major U.S. Enterprises, 2020–2025 (Unit: USD 100 million, %)
Chart 55: Number of Patent Applications in U.S. Smart Retail, 2017–2025 (Unit: items)
Chart 56: Number of Patent Applications in U.S. Smart Retail, 2018–2025 (Unit: items)
Chart 57: Number of Authorized Patents in U.S. Smart Retail, 2019–2025 (Unit: items)
Chart 58: Characteristics of the U.S. Retail Industry
Chart 59: Proportion of Types of Retail Market Entities in the U.S. in 2025 (Unit: %)
Chart 60: Number of Retail Enterprises in the U.S., 2020–2025 (Unit: units, %)
Chart 61: Total Retail Sales of Consumer Goods in the U.S., 2019–2025 (Unit: trillion USD, %)
Chart 62: Entry Progress of Retail Competitors in the U.S. (Unit: ten thousand yuan)
Chart 63: Heat Map of Regional Distribution of Retail Competitors in the U.S.
Chart 64: Strategic Layout of Retail Competitors
Chart 65: Strategic Clusters of Retail Enterprises
Chart 66: Top 100 U.S. Retailers in 2025 (Unit: USD 100 million)
Chart 67: Proportion of Sales of Top 100 U.S. Retailers to Total Retail Sales of Consumer Goods, 2018–2025 (Unit: %)
Chart 68: Global Market Participation in the Retail Industry in 2025 (Unit: USD 100 million, %)
Chart 69: Bargaining Power of Suppliers in the Retail Industry
Chart 70: Bargaining Power of Consumers in the Retail Industry
Chart 71: Threat of New Entrants in the Retail Industry
Chart 72: Threat of Substitutes in the Retail Industry
Chart 73: Competitive Rivalry Among Existing Firms in the Retail Industry
Chart 74: Summary of Porter’s Five Forces Analysis of the Retail Industry
Chart 75: Summary of Investment and Financing in the U.S. Retail Industry, 2020–2025
Chart 76: Drivers of Industry Mergers and Restructuring
Chart 77: Summary of M&A Events in the U.S. Retail Industry, 2020–2025
Chart 78: Forecast of M&A Trends in the Retail Industry
Chart 79: IPOs in the U.S. Retail Industry, 2020–2025
Chart 80: Structure of U.S. FMCG Retail Channels in 2025 (Unit: %)
Chart 81: Classification and Basic Characteristics of Store-based Retail Formats
Chart 82: Classification and Basic Characteristics of Non-store Retail Formats
Chart 83: U.S. E-commerce Transaction Volume and Growth, 2017–2025 (Unit: trillion USD, %)
Chart 84: Structure of the U.S. E-commerce Market in 2025 (Unit: %)
Chart 85: Retail Formats of Shopping Centers in Different Regions (Unit: %)
Chart 86: Number of Newly Opened Shopping Centers in the U.S., 2018–2025 (Unit: units)
Chart 87: Existing Scale and Growth of U.S. Shopping Centers, 2011–2025 (Unit: 100 million square meters, %)
Chart 88: Changes in Top 10 Supermarket Chains in 2021 (Unit: USD 100 million, units)
Chart 89: Comparison of Competitiveness and Disadvantages Between Traditional and New Convenience Stores
Chart 90: Comparison of Models Between Traditional Convenience Stores and Unmanned Convenience Stores (Unit: square meters)
Chart 91: Comparison of Models Between Traditional Convenience Stores and Unmanned Convenience Stores (Unit: square meters, %, units)
Chart 92: Trend of Population Coverage of the U.S. Convenience Store Industry, 2018–2025 (Unit: people/store)
Chart 93: Analysis of Convenience Store Development Trends
Chart 94: Sales Growth of Specialty Stores of U.S. Chain Retail Enterprises, 2017–2025 (Unit: USD 100 million, %)
Chart 95: Sales of Household Appliances and Electronics Specialty Retail in the U.S., 2019–2025 (Unit: USD 100 million)
Chart 96: Number and Growth of U.S. Chain Pharmacy Enterprises, 2015–2025 (Unit: units)
Chart 97: Number of Chain Pharmacy Stores in the U.S., 2018–2025 (Unit: ten thousand stores)
Chart 98: Advantages and Disadvantages of the Direct Chain Model
Chart 99: Advantages and Disadvantages of the Franchise Chain Model
Chart 100: Top 10 Direct Chain Pharmacy Stores in the U.S., 2020–2025
Chart 101: Development Trends in Geographic Selection for Chain Pharmacies
Chart 102: Development Trends in Business Content for Chain Pharmacies
Chart 103: Number of Gold and Jewelry Booths, 2019–2025 (Unit: units)
Chart 104: Transaction Value of the Gold and Jewelry Retail Market, 2019–2025 (Unit: USD 100 million)
Chart 105: Overview of Various Sales Models in the Jewelry Industry
Chart 106: Development Trends of the U.S. Gold and Jewelry Industry
Chart 107: New Retail Investment Events and Investment Scale in the U.S., 2019–2025 (Unit: cases, USD 100 million)
Chart 108: Retail Sales of Goods Above Designated Size in the U.S. in 2025 (Unit: USD 100 million)
Chart 109: Retail Sales and Growth of Grain, Oil, Food, Beverages, Tobacco, and Alcohol Above Designated Size, 2018–2025 (Unit: USD 100 million, %)
Chart 110: Consumer Price Index for Food, 2020–2025
Chart 111: Analysis of Food Sales Methods
Chart 112: Cumulative Retail Sales of Clothing, Footwear, Hats, Knitted, and Textile Goods Above Designated Size in the U.S., 2018–2025 (Unit: USD 100 million, %)
Chart 113: Consumer Price Index for Clothing in the U.S., 2021–2025
Chart 114: Characteristics of Major International SPA Brands
Chart 115: Four Key Features of the SPA Model
Chart 116: Four Core Modules of the SPA Model
Chart 117: New Competitive Characteristics in the Apparel Industry
Chart 118: Development History of Apparel E-commerce in the U.S.
Chart 119: Main Characteristics of the U.S. Apparel Industry
Chart 120: Retail Sales of Daily Necessities Above Designated Size in the U.S., 2018–2025 and Their Changes (Unit: USD 100 million, %)
Omitted… For the complete table of contents, please inquire via email
II. Our research focus:
1. Policy environment
Conduct comprehensive and in-depth research on the international and domestic economic environment in which the industry operates, analyze industrial policies and related supporting policy trends, and grasp the development direction of industry policies.
2. Investment trends
Starting from newly built and ongoing projects of the year, focus on studying the current state of industry investment and existing issues, providing investors with development strategies and investment recommendations.
3. Market supply and demand
Relying on a powerful database, analyze the current state of market supply and demand through data, provide industry information, and scientifically forecast supply and demand trends for the next 3–5 years.
4. Market competition
Conduct comparative analysis of the operating conditions of the top 30 key enterprises in each industry, including production, sales, performance, as well as their respective business strategies and competitive advantages.
III. Our advantages:
1. Rich expert resources and information resources
Leveraging proprietary databases and AI large-model systems with abundant data resources, we have built a distinctive and comprehensive industry monitoring system.
2. Broad industry coverage with strong targeting
While conducting comprehensive industry analysis, we also perform separate analyses of important sub-sectors or products. The information is extensive and highly practical.
3. Comprehensive content and vivid presentation
The report is based on empirical descriptions using the latest data of the year, supported by rich data and charts, emphasizing readability and visual appeal while avoiding clichés and empty statements.
4. Deep insight and foresight
Provide insights into the future development direction of the industry, the evolution of competitive landscape, as well as technical standards, market size, potential issues, and key challenges in industry development.
5. Creative and constructive policy recommendations
Analyze and demonstrate aspects such as investment characteristics, market size, supply and demand conditions, competitive landscape (structure and major competitors), and development trends of the industry or specific products.